
MonaGO is a visualization tool for Gene Ontology (GO) enrichment which facilitates a better interpretation of GO enrichment results by using innovative interactive visualization techniques. MonaGO can visualize GO enrichment analysis results produced by DAVID, or enriched GO terms directly.
Three kinds of input are supported in MonaGO.
There are two ways to submit enriched GO terms.
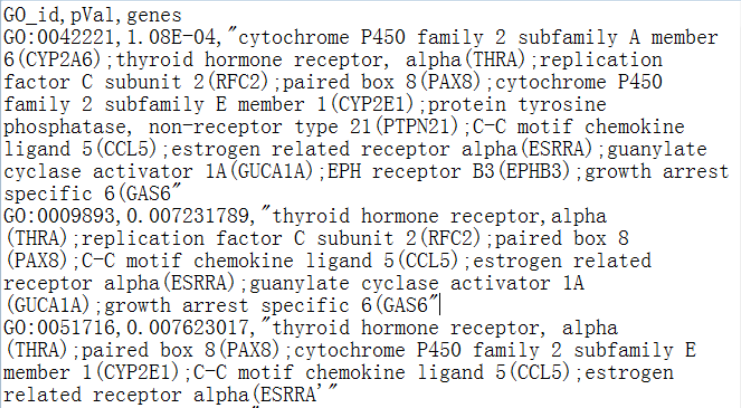
(1) Pasting enriched GO terms in the text area manually. The text needs to be in a comma-delimited format, where each line contains three columns: (1) the enriched GO term ("GO_id"), (2) the enrichment values (e.g., p-values, "pVal"), and (3) the list of genes ("genes"). As shown in the screenshot below, the list of genes of an enriched GO term should be separated by semicolons. Note that the header shouldn't be included.
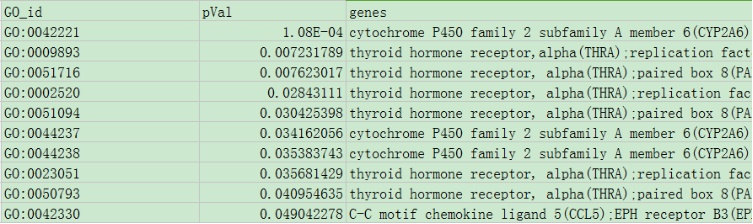
(2) Submiting enriched GO terms by uploading a csv file, which should be in the same format as above. The following screenshot shows an example csv file:
After entering enriched GO terms, there are several options for the visualisation.
(1) Choose p-value: The maximum p-value allowed can be selected using the sliding scale or entering a value manually.
(2) Choose distance measurement: The distance measurement can be selected using the drop-down menu. This is how the similarity between GO terms is compared so that similar terms can be clustered. There are three optionss for this; firstly 'Number of overlapping genes,' which is the percentage of genes common to the GO terms. The second two options 'Resnik similarity between GO terms' and 'Simrel between GO terms' are semantic similarity measurements between two GO terms.
(3) Advanced option: If a semantic similarity measurement is chosen in option (2), the advanced option drop-down menu appears. This allows advanced users to choose how to compare similarity scores between clusters of GO terms. 'Average' takes the average similarity of every combination of GO terms in the clusters, 'Minimum' considers the most informative ancestor common to all GO terms and thus takes the minimum similarity between the combinations, and 'Maximum' considers the most informative ancestor common to any combination of GO terms and thus takes the maximum similarity between the combinations.
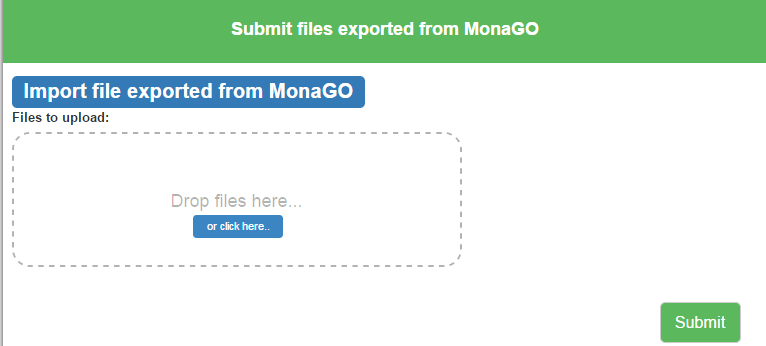
A JSON file that stores the current state of the main chord diagram can be downloaded and uploaded to get restoration. Submission Interface can be seen below.
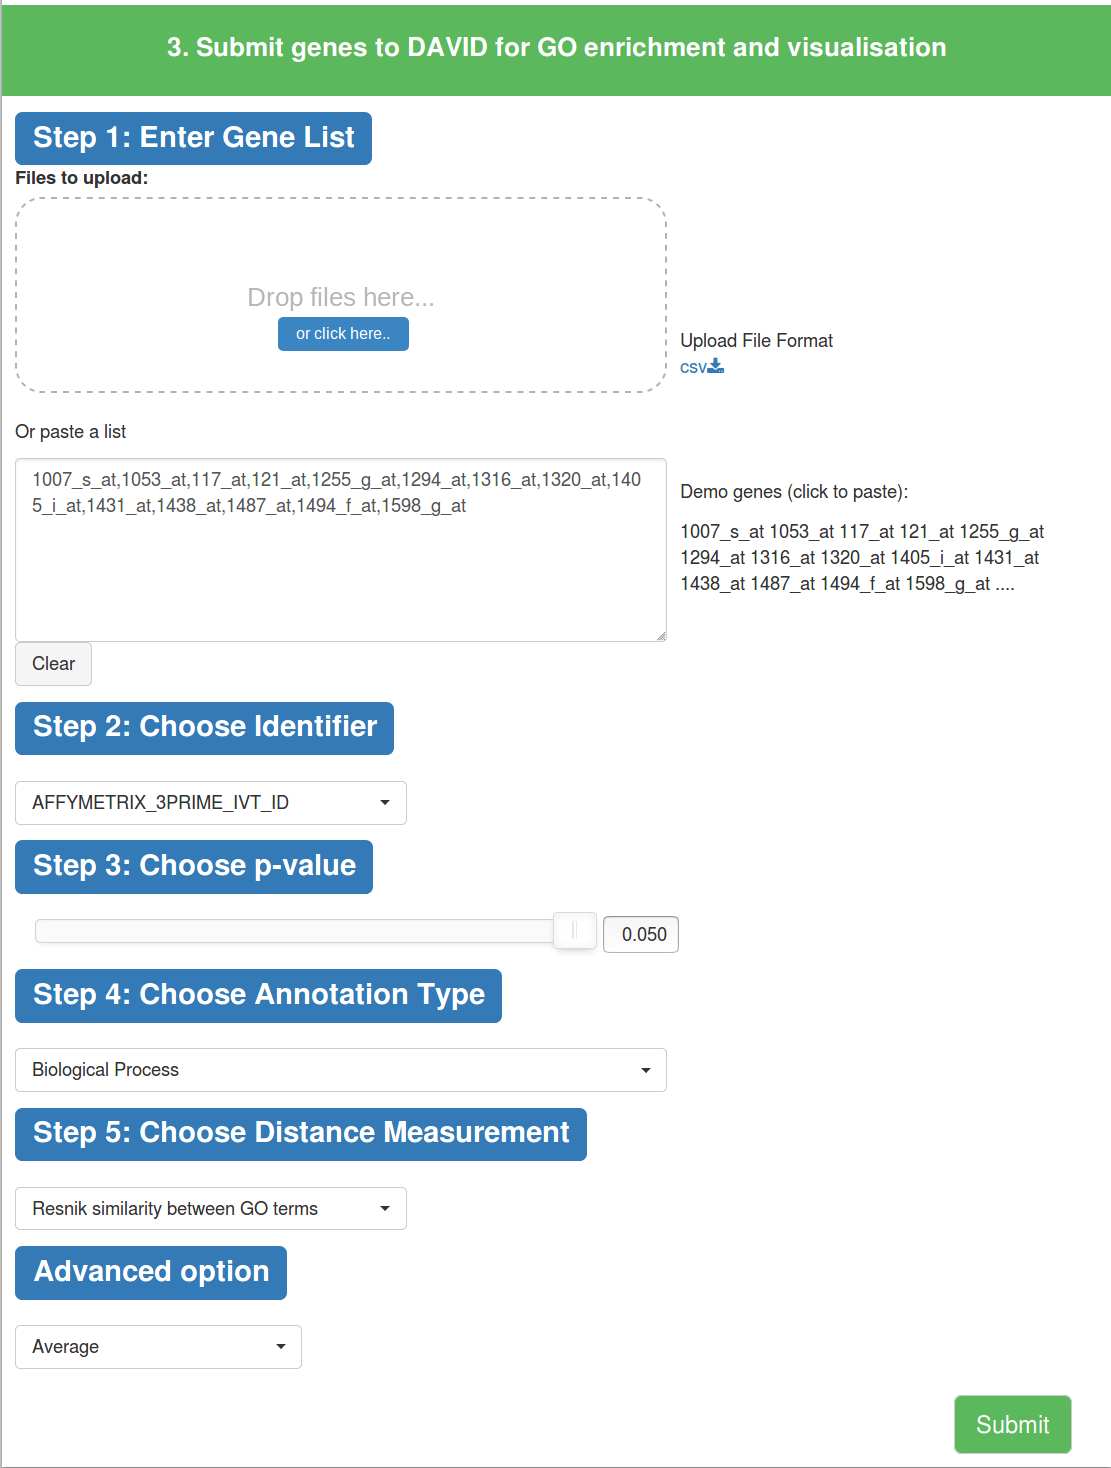
A user can submit a list of genes on MonaGO to DAVID to obtain GO enrichment results and visualize them.
(1) Input a list of genes or upload a file to identify over-represented GO terms.
(2) Select the appropriate gene identifier.
(3) Choose p-value to filter the enrichment result, as in 1.1.
(4) Choose the GO annotation type (Biological Process, Molecular Function, Cellular Component).
(5) Choose the distance measurement based on common genes or semantic similarity, as in 1.1
(6) Advanced option to choose how to compare similarity scores between clusters of GO terms, as in 1.1
MonaGO utilizes the following options in Functional Annotation Tool of DAVID.
(1) Input of gene lists are posted to Step 1 (Enter Gene List)
(2) Gene identifier selected are posted to Step 2 (Select Identifier)
(3) Select Gene List in Step 3
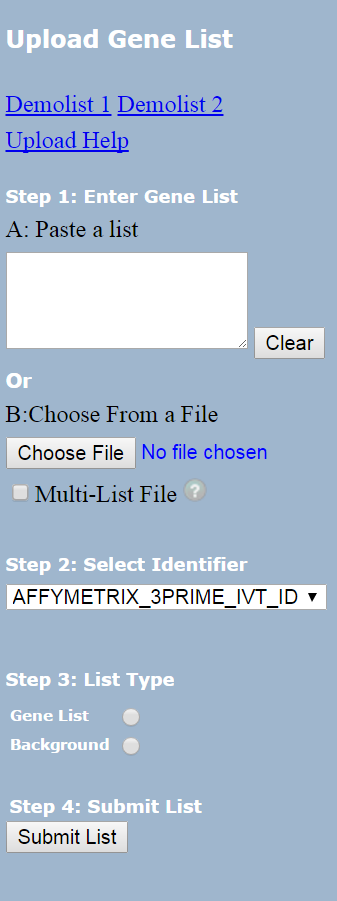
Default options are selected in Functional Annotation Chart when getting results of related GO terms and P-values.

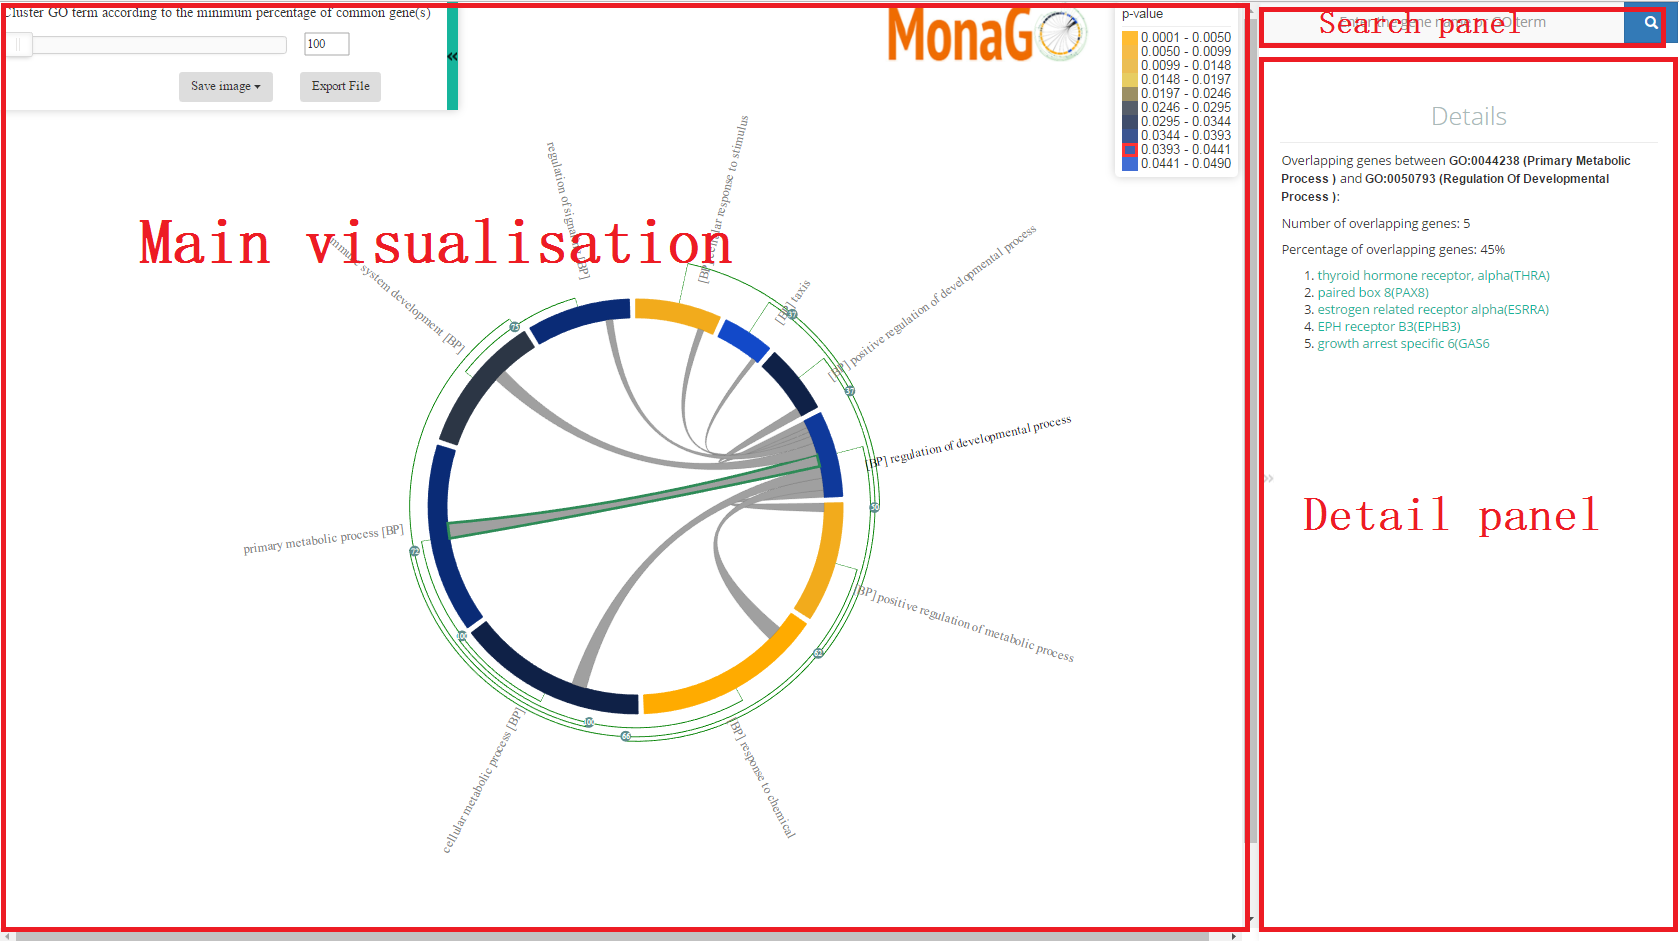
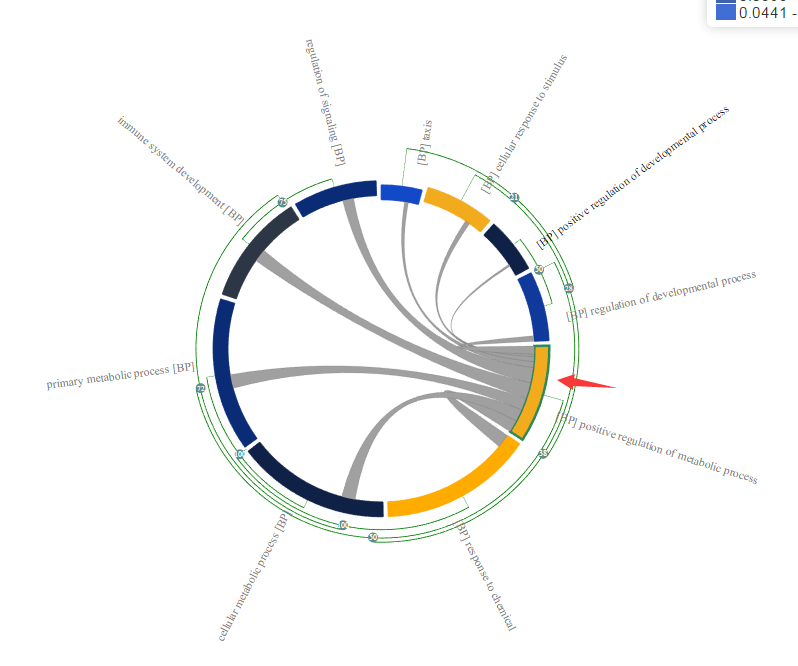
The main visualization component is the chord diagram, which has auxiliary visual elements attached to it, including the GO term labels and the hierarchical clustering tree.Prefixes are used in label to differentiate 3 branches of GO, such as BP (biological process), CC(cellular component) and MF(molecular function).
Each element in the chord diagram represents a GO term or a cluster of GO terms. Length of the element is proportional to number of genes related with the GO term or a cluster of GO terms. The edges inside the chord diagram between two elements denote the fact that there are common genes between them.
Additionally, on each element two types of information are displayed: Name of the GO term, or, for a cluster, the name of the GO term with the lowest p-value, and the hierarchical clustering tree that allows the collapsing/expansion of GO terms.
Note that the size and the position of the chord diagram can be changed by zooming in and out.Clustering can be performed systematically or manually using the hierarchical clustering tree: The slider on the top left allows systematic clustering of GO terms based on the threshold of either the minimum number of common genes, or the average/minimum/maximum semantic similarity between GO terms in clusters. Alternatively, the nodes in the hierarchical clustering tree can be clicked to manually collapse GO /terms/clusters and expand clusters.
Image of main diagram can be saved in two formats, svg and png, by clicking drop-down menu button on top left (Save image).
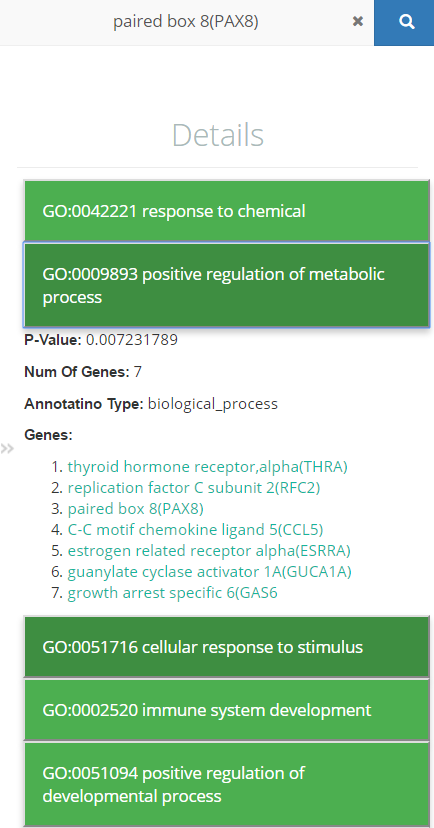
The details panel shows detailed information about a GO term or a cluster in the main visualization panel. The details panel is activated when the mouse hovers over a GO term/cluster or an edge in the chord diagram.
Note that edge can be clicked and highlighted to freeze the detail panel. For highlighted edge, click again can release detail panel.
The following information is shown in the details panel.
For a GO term:
Its ID,
Its name,
The p-value,
The list of genes expressed for this term, and
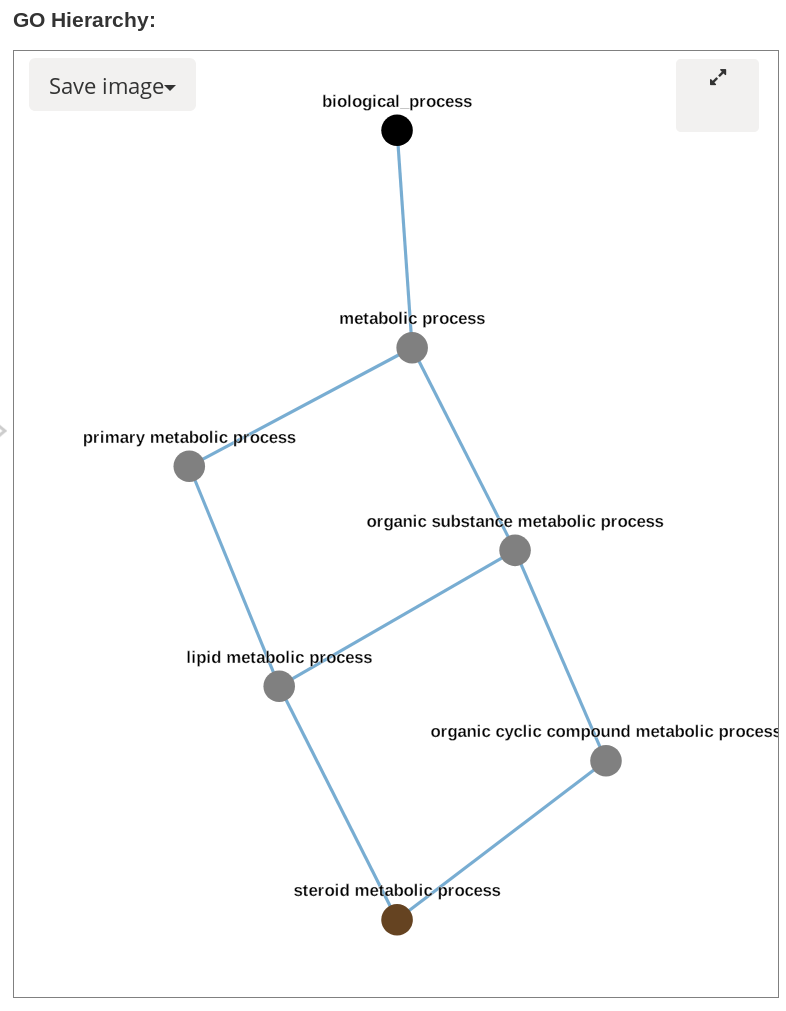
The part of the GO hierarchy from this term to the top term (Biological Process, Cellular Component, or Molecular Function).
For a cluster (or edges between clusters):
The IDs of GO terms in the cluster, separated by commas,
The names of GO terms in the cluster, separated by commas,
The number of common genes among the GO terms in the cluster,
The average p-value of all GO terms in the cluster, and
The list of names of all common genes.
For an edge between two GO terms:
The IDs of GO terms, separated by commas,
The names of GO terms, separated by commas,
The number of common genes among the GO terms,
The average p-value of the GO terms,
The list of names of all common genes,
The semantic similarity between the GO terms (if a semantic distance measurement was chosen),
The most informative ancestor common to the GO terms (if a semantic distance measurement was chosen and the similarity is >0), and
The part of the GO hierarchy from each of the GO terms to the top term (if a semantic distance measurement was chosen).
GO hierarchy images in svg and png format can be downloaded by clicking save image button:
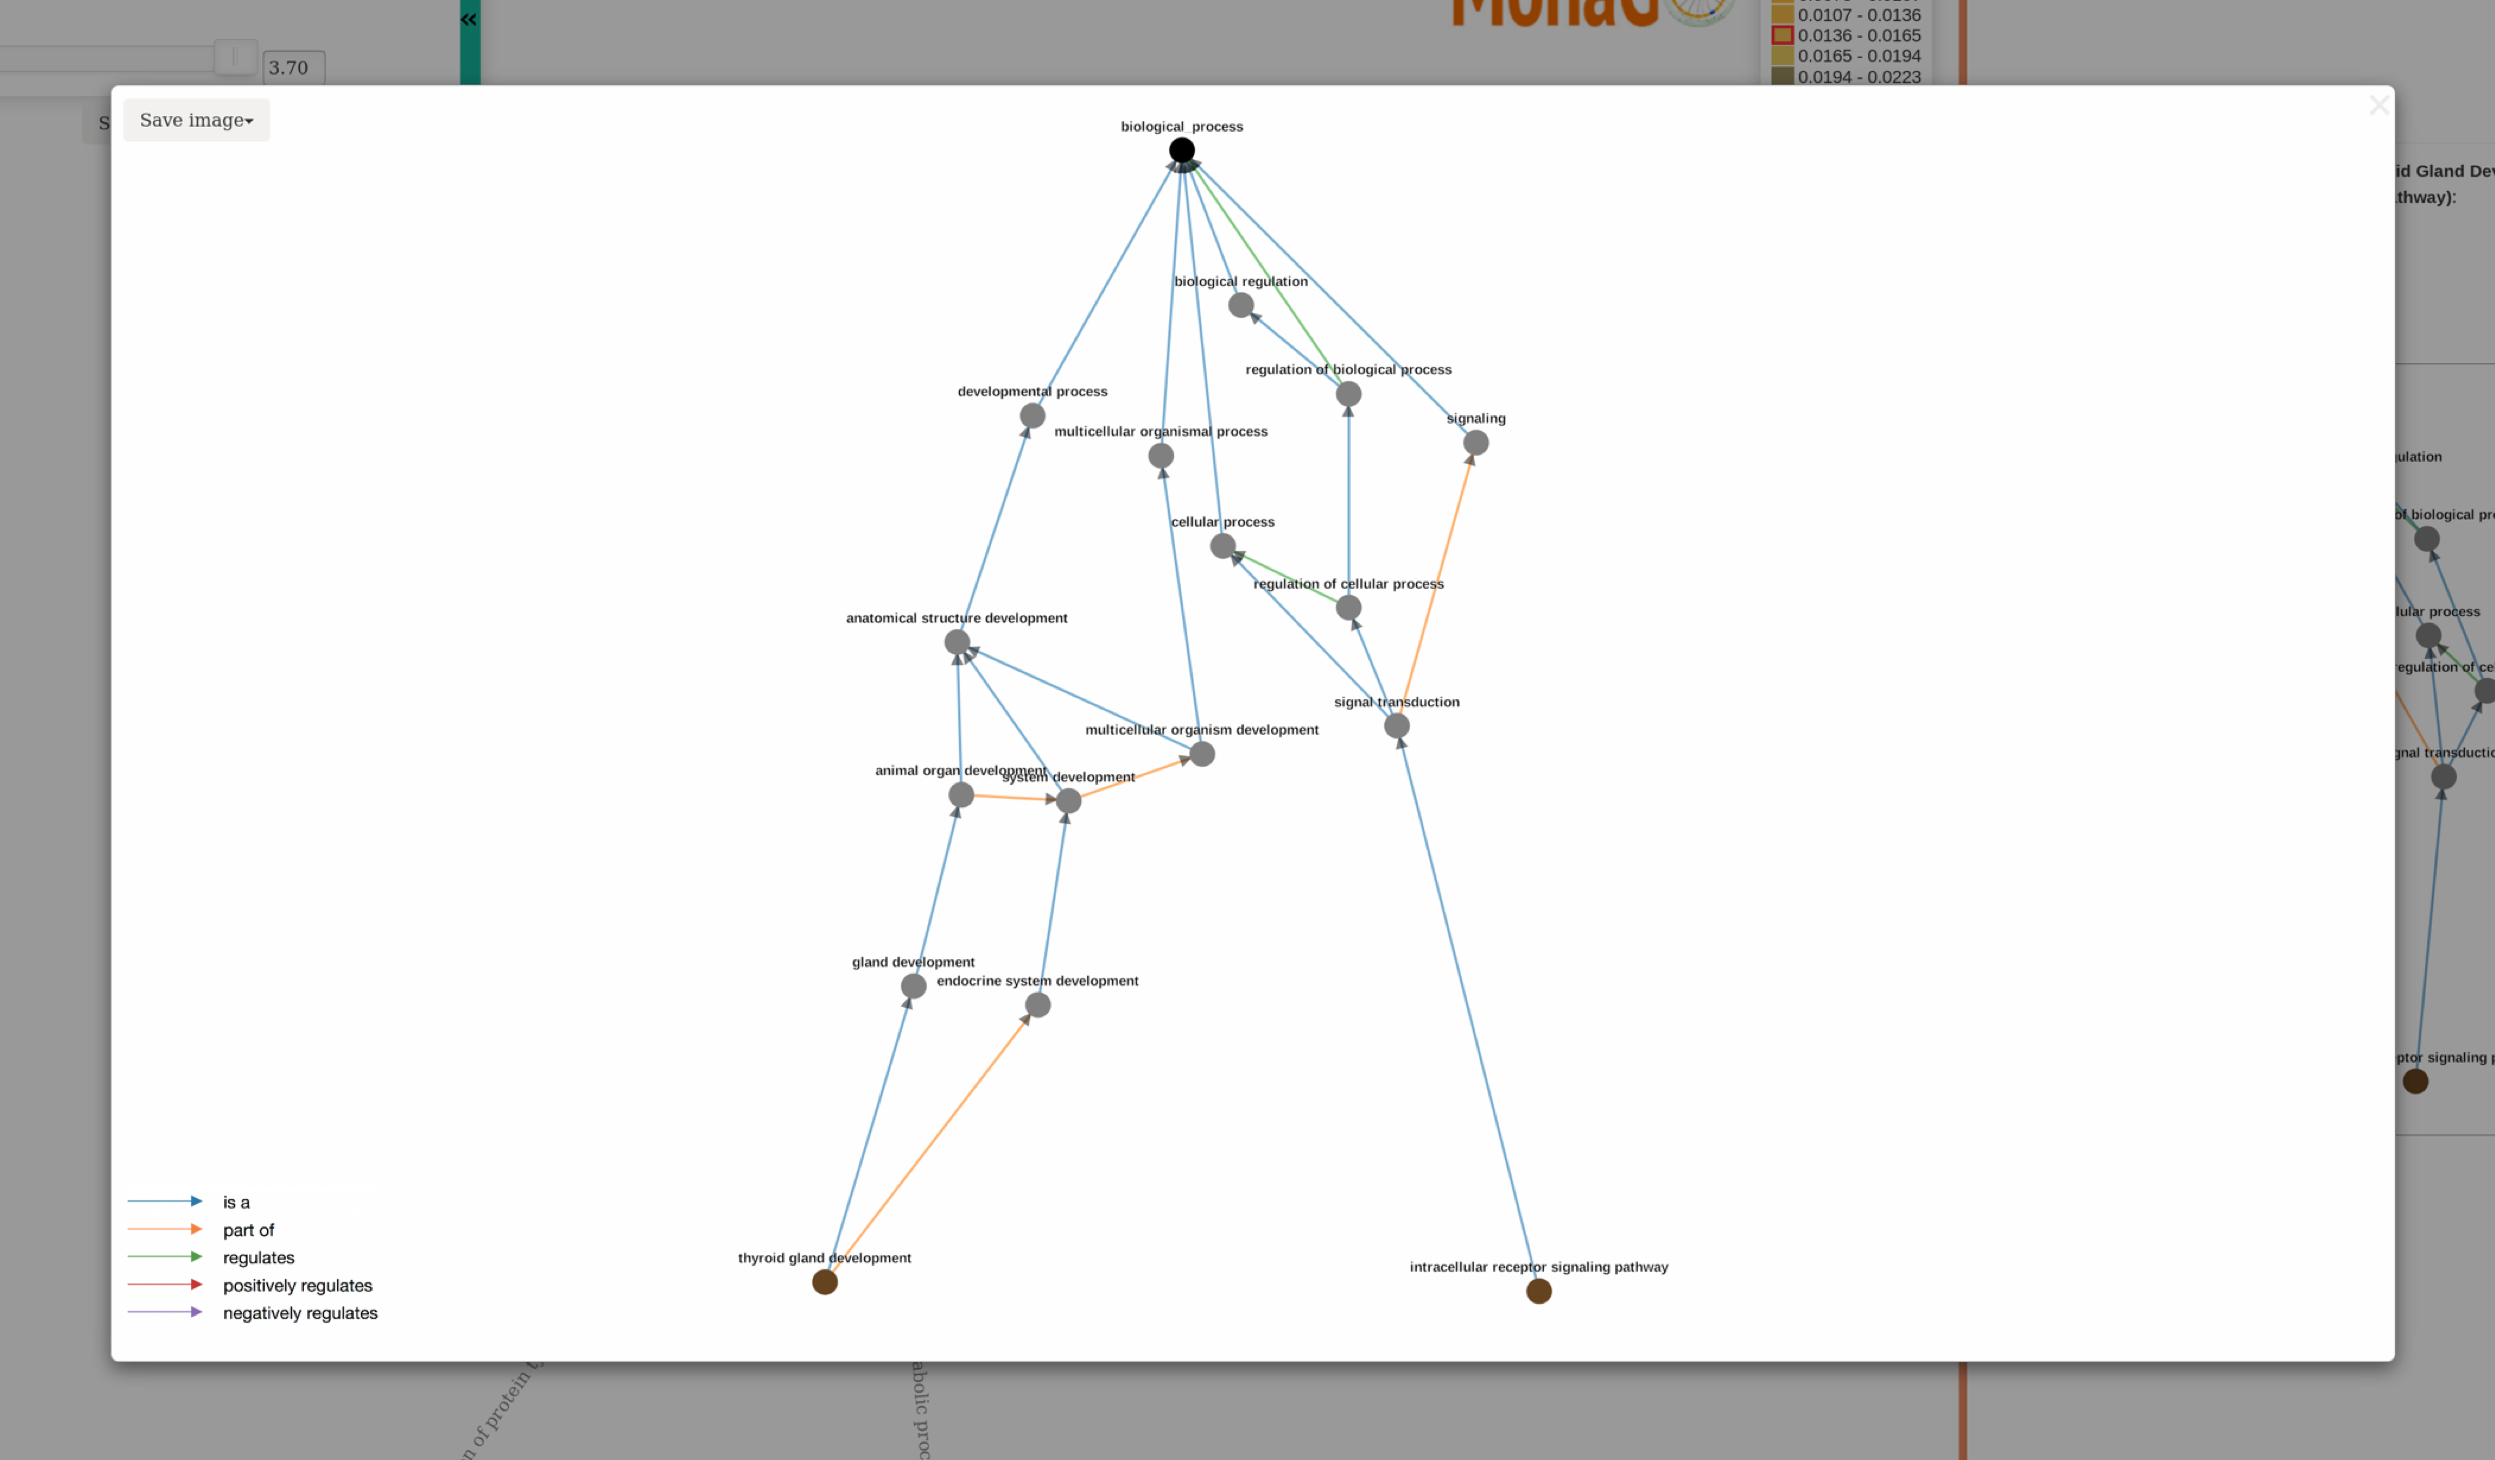
If more information is needed or the tree is unclear due to too many nodes, the image can be expanded by clicking the button in the top right. This opens a modal with the image taking up the whole screen. Arrowheads are included on the links such that children GO terms are pointing towards parents. There is a legend on the bottom left which describes the relationships associated with different arrow colours. Nodes can be dragged around until tree is more clear, and this image can be saved in svg or png format by clicking the save button. To exit the modal click out of it.
The search panel allows the search of GO terms by gene names, and IDs or names of GO terms (search by its full name).
All GO terms/clusters relevant to a search query will be highlighted (popping out) on the chord diagram in the main visualization panel. Moreover, relevant GO terms/clusters will be listed in the details panel.
 |
 |
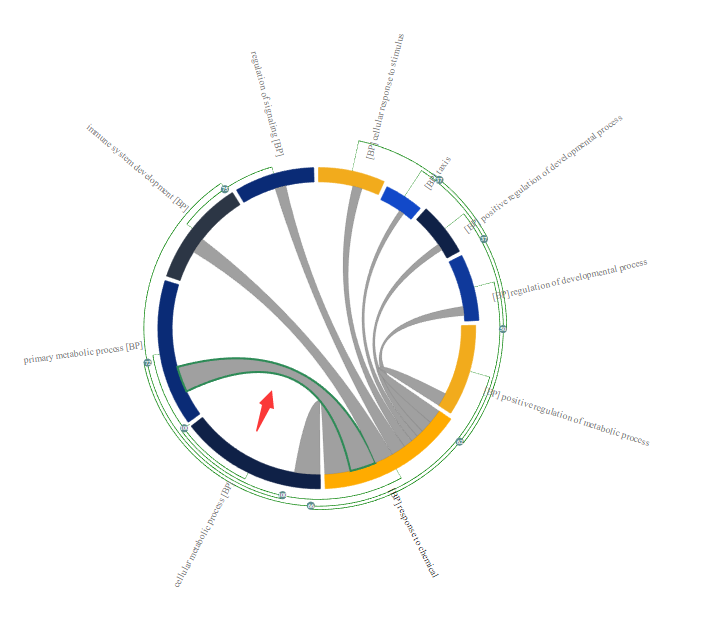
MonaGO helps users reduce redundancy by assisting user to cluster similar GO term. In MonaGO, enriched GO terms are ordered and visualised in a way that GO terms whose common genes percentage (Cluster A AND Cluster B/ Cluster A OR Cluster B) or semantic similarity is larger are closer to each other.
In this way, user can easily group them as cluster in which only the most represented GO terms will be displayed in the chord diagram, thereby reducing the “information overload”. Following is an example of GO enrichment result visualised in MonaGO. As shown in the picture below, many enriched GO terms are redundant. An example is the redundancy between GO1 and GO2(They share 11 common genes which takes 100% of their total genes thus considered to be highly related, assuming number of overlapping genes is the distance measurement selected). Therefore they are placed right next to each other.
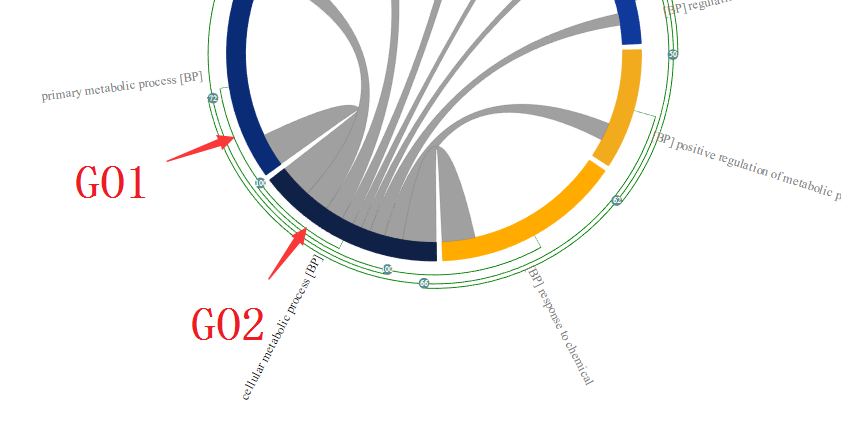
Grey curved lines inside the circle are indicators that the GO terms connected share common genes. User can move the cursor on a particular line to see a list of common genes shared the two connected GO terms on the detailed panel.
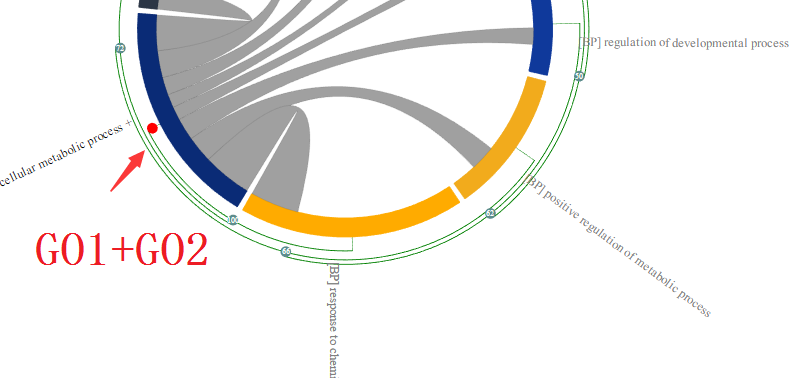
When grouped these two enriched GO terms together as shown above, the one that is most represented(with lower p-value), in this case, GO2 is displayed. As a result, the redundancy of the enriched GO term is reduced and help user to have better understanding of the enrichment result.
Yuan-Fang Li: yuanfang.li@monash.edu
Mirana Ramialison: mirana.ramialison@monash.edu
The source code is available on GitHub.